3. Scripting & notebooks
3.Scripting.RmdScripting
A little bit of scripting can go quite a long way in scaling up this pipeline. In this section, we’ll walk through some standard scripts for batch object creation and looping through registration correction for each mouse. Once all the registrations in a mouse are finished, we also have scripts that perform batch segmentation importation, cleaning of regions to omit, and mapping. For this section, we recommend spending a little time learning R syntax to better understand and even modify these scripts for your own use. Swirl is an excellent interactive resource to check out.
Batch object creation
Although the organization of data into objects ensure a logical and heirarchical data management structure in SMARTR, it can be super tedious to manually create each mouse and slice object and store each slice object into the appropriate mouse object. Here we provide a script that essentially performs this process automatically after reading in an excel file where users can more easily enter and edit metadata for mouse and slice object. Download the template here!
When you open the template, you will see the left side (green colored columns) includes columns to populate the mouse metadata.
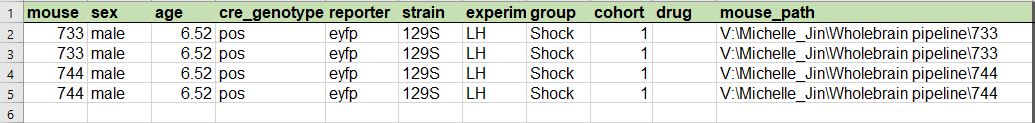
The right side (blue colored columns) includes columns where slice metadata is populated. Each row in the sheet will be read and used to create a new slice object.

Paste over the example entries with your own mouse and slice parameters.
For the slice metadata, the registration path column includes a formula to auto create a path to the max projection image from the pre-processing steps. You can drag this formula down to autopopulate the column. If you have a separate process and naming structure to create a flattened image, you can override this formula. Additionally, the left_regions_excluded and right_regions_excluded columns allow for entry of a default custom list of regions to exclude from each hemisphere. If left empty, the default list is used. If you are going to append your own acronyms, please make sure there are no spelling mistakes!
Once you’re done entering into the spread sheet, either download or copy and paste the script below into R.
# This batch script:
# Reads the parameters from a .xlsx file
# Auto creates the mouse and slice objects
# Automatically saves the mouse objects in designated mouse output folder


# Dependencies:
library(SMARTR)
library(tidyverse)
library(magrittr)
library(stringdist)
library(readxl)


# Choose the batch excel file
xlsx_path <- file.choose()

#_____________________ autocreate mouse objects _______________________________
# Autocreate each mouse object and save in the mouse directory as it's output folder

# Read sheet, select mouse cols and collapse into distinct values
df <- read_excel(xlsx_path,
                 na = c("", "NA"),
                 col_names = TRUE)

mouse_cols <- names(df[1:(which(names(df) == "slice") - 2)])
slice_cols <- names(df[which(names(df) == "slice"):length(df)])

mice_info <- df %>% dplyr::select(all_of(mouse_cols)) %>% distinct()

for (m in 1:length(mice_info$mouse)){

  my_mouse <- mouse(mouse_ID = mice_info$mouse[m],
                    sex = mice_info$sex[m],
                    age = mice_info$age[m],
                    cre_genotype = mice_info$cre_genotype[m],
                    reporter = mice_info$reporter[m],
                    strain = mice_info$strain[m],
                    experiment = mice_info$experiment[m],
                    group = mice_info$group[m],
                    drug = mice_info$drug[m],
                    cohort = mice_info$cohort[m],
                    output_path = mice_info$mouse_path[m])


  # Save the mouse, then remove it from the environment
  assign(paste0("mouse_", mice_info$mouse[m]), my_mouse)
  eval((parse(text=paste0("save_mouse(mouse_", mice_info$mouse[m],")"))))
  eval((parse(text=paste0("rm(mouse_", mice_info$mouse[m],")"))))

}

#_____________________ autocreate slice objects _______________________________

# For each new slice
# Detect if the mouse has changed
# Load the current mouse mouse
# Create and populate the slice info
# Add it to the mouse
# Check if the next slice belongs to the same mouse
# If not, save the mouse and delete it from the environment
# Move onto next mouse

change_mouse <- TRUE
for (s in 1:length(df$slice)){

  if (change_mouse && s != 1){
    # search, save, then remove current mouse
    eval((parse(text=paste0("save_mouse(", cur_mouse, ")"))))
    eval(parse(text=paste0("rm(", cur_mouse, ")")))

    # Load the new mouse
    load(file.path(df$mouse_path[s], paste0("mouse_", df$mouse[s], ".RDATA")))
    cur_mouse <- ls()[amatch("mouse_", ls(), maxDist = 4)]
    change_mouse <- FALSE
  } else if (s == 1) {
    # Load the new mouse
    load(file.path(df$mouse_path[s], paste0("mouse_", df$mouse[s], ".RDATA")))

    # current mouse
    cur_mouse <- ls()[amatch("mouse_", ls(), maxDist = 4)]
    change_mouse <- FALSE
  }

  # Convert the hemispheres column to lower case
  df$hemisphere <-  map_chr(df$hemisphere, tolower)

  if (df$hemisphere[s] == "right" || df$hemisphere[s] == "left"){
    hemi <- df$hemisphere[s]
  } else {
    hemi <- NULL
  }

  # Convert the channels to a vector
  channels <- df$channels[s] %>% gsub(" ", "", .) %>%  str_split(.,",") %>% unlist()


  # Take the default set of regions to exclude if not specified explicitly in the sheet
  if (is.na(df$left_regions_excluded[s])){
    left_regions_excluded <- c("layer 1", "fiber tracts", "VS")
  } else{
    left_regions_excluded <- df$left_regions_excluded[s] %>% gsub(" ", "", .) %>%
      str_split(.,",") %>% unlist()
  }

  if (is.na(df$right_regions_excluded[s])){
    right_regions_excluded <- c("layer 1", "fiber tracts", "VS")
  } else{
    right_regions_excluded <- df$right_regions_excluded[s] %>% gsub(" ", "", .) %>%
      str_split(.,",") %>% unlist()
  }

  # Populate the slice information
  my_slice <- SMARTR::slice(slice_ID = df$slice[s],
                            coordinate = df$`atlas coordinate`[s],
                            conversion_factor = df$`conversion factor`[s],
                            bin = df$bin[s],
                            z_width= df$`z-width (um)`[s],
                            hemisphere = hemi,
                            channels = channels,
                            registration_path = df$`registration path`[s],
                            left_regions_excluded = left_regions_excluded,
                            right_regions_excluded = right_regions_excluded)

  eval(parse(text = paste0(cur_mouse, "<- add_slice(", cur_mouse, ", my_slice, replace = TRUE)")))
  print(eval(parse(text = paste0(cur_mouse))))

  # get current mouse number
  cur_mouse_no <- str_split(cur_mouse, "_") %>% unlist()
  cur_mouse_no <- cur_mouse_no[-1] %>% as.double()

  if (s == length(df$mouse)){
    # Save mouse if its the last one
    eval((parse(text=paste0("save_mouse(", cur_mouse, ")"))))
  } else if (df$mouse[s + 1] != cur_mouse_no){
    change_mouse = TRUE
  }
}
Registration correction looping notebooks
To improve the experience of registrations, we provide an interactive notebook for looping through each image. This automatically streamlines the process of finding an accurate brain contour for each image, and will auto-loop to the next image to register within each mouse. Instructions for each code chunk are included in the notebook.
Batch segmentation importation and mapping
To automate the process of atlas mapping across many mice, we provide a demo batch script that allows for batch segmentation importation, mapping, region exclusion, and concatenation of datasets across all slices for each mouse. Before running this code, make sure all registrations are complete within all mice. Additionally make sure all segmentation macros in ImageJ have been run on all images so that segmentation output is available for importation into SMARTR.